8. Interactive HTML Reporting Dashboards
Structure, value types, data dictionary, and mathematical formulas of daily_signal_report.html and scenario diagnostic tearsheets.
Key Takeaways for Investors & Traders
Consolidates all strategy signals into a single interactive daily_signal_report.html interface.
Exhaustively specifies every column in Top Ranked Promising Symbols, from rank and ticker to streak and Rank Score.
Documents the exact mathematical formulation of Rank Score, Persistence Streaks, and 15m EMA Regime Multipliers.
Clarifies the crucial operational distinction between real-time sweep diagnostics and downstream candidate scoring.
Executive Summary
Following daily execution, the reporting engine compiles interactive, self-contained HTML dashboards. These interfaces feature top-level KPI summary cards, intraday EMA regime distribution charts, the definitive 11-column Top Ranked Promising Symbols table with full mathematical conviction scoring, and per-scenario diagnostic teardowns.
Master Daily Signal Dashboard Components (`daily_signal_report.html`)
The master signal report (daily_signal_report.html) is compiled after the completion of all 35 parameter sweep scenarios. It provides an interactive diagnostic interface structured into four primary visual zones:
- Top-Level KPI Summary Cards:
- Total Equities Analyzed: The number of liquid equities passing minimum volume gates (e.g. 1,842).
- Total Active Triggers: Total non-neutral signals generated across the universe.
- Long / Short Bias: Distribution of bullish versus bearish directives across the equity universe.
-
Intraday Confirmation Rate: The proportion of active daily signals confirmed by 15-minute EMA alignment.
-
15m EMA Regime Distribution Visualizer:
-
Bar and donut charts displaying the breakdown of universe equities across
AAA(Bullish Trend),BBB(Bearish Trend),NEUTRAL(Transition / Chop), andBYPASS(Filter Disabled) regimes. -
Top Ranked Promising Symbols Table (11 Columns):
-
Real-time diagnostic table ranking candidate securities by composite statistical conviction, persistence, and regime synergy.
-
Parameter Sweep Scenarios Comparison Table (7 Columns):
- Tabulates signal volume, confirmation rates, and mean scores across all 35 scenario combinations ($A_1$ through $G_5$).
Comprehensive 11-Column Schema & Value Types Reference for Top Ranked Promising Symbols
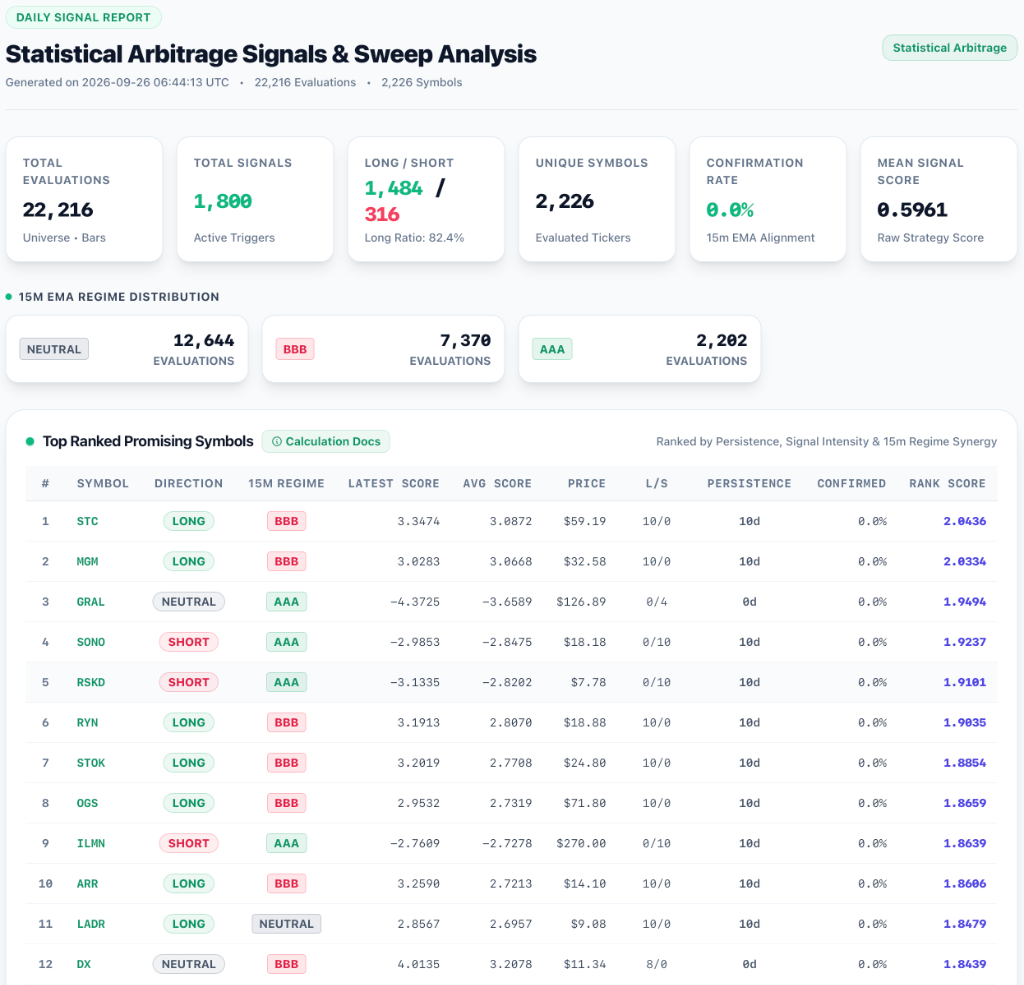
The Top Ranked Promising Symbols table in daily_signal_report.html is the real-time signal diagnostics, statistical conviction, and persistence evaluation interface. It displays 11 structured numerical and categorical columns computed per equity symbol across the aggregated parameter sweep space:
| # | Column Header | Internal Field | Data Type / Format | Value Domain / Range | Mathematical Definition & Description |
|---|---|---|---|---|---|
| 1 | # |
rank |
int (Integer) |
$1, 2, \dots, N$ | Sequential 1-based rank sorted primarily by Rank Score ($\downarrow$). |
| 2 | Symbol |
symbol |
str (Ticker String) |
Uppercase ASCII string | Equity ticker symbol (e.g., AAPL, NVDA, STC, MGM). |
| 3 | Direction |
latest_direction |
str (Categorical String) |
{'LONG', 'SHORT', 'NEUTRAL'} |
Most recent directional trading stance emitted on the latest calculation date. |
| 4 | 15m Regime |
latest_regime |
str (Badge String) |
{'AAA', 'BBB', 'NEUTRAL', 'BYPASS'} |
Intraday 15-minute EMA alignment: AAA (Bullish Stack), BBB (Bearish Stack), NEUTRAL (Chop), BYPASS (Filter disabled). |
| 5 | Latest Score |
latest_score |
float (64-bit Float) |
$(-\infty, +\infty)$ | Raw mathematical strategy score $S_T$ on the most recent calculation bar (e.g., Omega differential for Momentum Omega, negative Z-score for Mean Reversion/Stat Arb, MA spread % for Trend Following, channel distance for Volatility Breakout). |
| 6 | Avg Score |
avg_score |
float (64-bit Float) |
$(-\infty, +\infty)$ | Mean strategy score $\mu_S = \frac{1}{M}\sum_{t=1}^M S_t$ across all evaluation bars in the lookback window. |
| 7 | Price |
latest_price |
float (Currency String) |
$XX.XX` (Positive USD) | Most recent split-adjusted closing price in USD (e.g., `$59.19). |
|
| 8 | L / S |
long_triggers / short_triggers |
str (Ratio String) |
{N_long}/{N_short} |
Breakdown of active directional triggers formatted as {N_long}/{N_short} (e.g., 10/0 indicating 10 Long triggers and 0 Short triggers). |
| 9 | Persistence |
persistence_streak |
int (Duration String) |
{P}d ($P \ge 0$) |
Number of consecutive trailing daily bars $P$ the symbol maintained its current signal direction without interruption (e.g., 10d). |
| 10 | Confirmed % |
confirmed_rate |
float (Percentage String) |
XX.X% ($[0.0\%, 100.0\%]$) |
Proportion of active triggers that aligned with the 15m intraday EMA trend filter ($C \in [0.0, 1.0]$). |
| 11 | Rank Score |
rank_score |
float (64-bit Float) |
$[0.0, +\infty)$ | Composite statistical conviction score combining signal intensity, activity frequency, persistence streak, and regime synergy multiplier. |
Mathematical Formulations & Metric Derivations
Let an individual equity symbol have a time-series of $M$ evaluations across the parameter sweep space:
$$\mathcal{D} = \{(t, S_t, D_t, P_t, R_t, c_t)\}_{t=1}^M$$
where $S_t \in \mathbb{R}$ is the raw strategy score, $D_t \in \{\text{LONG}, \text{SHORT}, \text{NEUTRAL}\}$ is the directional state, $P_t > 0$ is the closing price, $R_t \in \{\text{AAA}, \text{BBB}, \text{NEUTRAL}, \text{BYPASS}\}$ is the 15m EMA regime, and $c_t \in \{\text{True}, \text{False}\}$ is the confirmation status.
1. Mean Strategy Score ($\mu_S$)
The average strategy score measures the central tendency of the signal's mathematical magnitude over the evaluation horizon:
$$\mu_S = \frac{1}{M} \sum_{t=1}^M S_t$$
2. Active Trigger Frequency ($f_{\text{active}}$)
Measures the fraction of total evaluation bars during which the symbol generated an actionable non-neutral trigger:
$$N_{\text{long}} = \sum_{t=1}^M \mathbb{I}(D_t = \text{LONG}), \quad N_{\text{short}} = \sum_{t=1}^M \mathbb{I}(D_t = \text{SHORT})$$
$$N_{\text{active}} = N_{\text{long}} + N_{\text{short}}, \quad f_{\text{active}} = \frac{N_{\text{active}}}{M}$$
3. Trailing Persistence Streak ($P$)
Persistence measures the duration (in continuous daily bars) that an equity has maintained its current directional conviction without flipping or returning to neutral:
- If $D_M = \text{NEUTRAL}$, then $P = 0$.
- If $D_M \in \{\text{LONG}, \text{SHORT}\}$, the persistence streak $P$ counts consecutive matching trailing bars:
$$P = \max \left\{ k \in \{1, 2, \dots, M\} \;\middle|\; D_{M - i} = D_M \quad \forall \; 0 \le i < k \right\}$$
A high persistence streak ($P \ge 3$) reflects sustained multi-day momentum or persistent trend structure rather than a transient one-day anomaly.
4. 15m EMA Confirmation Rate ($C$)
The confirmation rate evaluates the proportion of active triggers that aligned with the 15-minute intraday trend filter:
$$C = \begin{cases} \frac{1}{N_{\text{active}}} \sum_{t \in \{i \mid D_i \neq \text{NEUTRAL}\}} \mathbb{I}(c_t = \text{True}) & \text{if } N_{\text{active}} > 0 \\ 1.0 & \text{if } N_{\text{active}} = 0 \text{ or filter disabled} \end{cases}$$
5. Composite Rank Score Formulation
The Composite Rank Score synthesizes signal intensity, trigger frequency, and trailing persistence into a unified continuous metric, scaled by an intraday regime synergy bonus:
$$\text{Base Score} = 0.50 \cdot |\mu_S| + 0.30 \cdot f_{\text{active}} + 0.20 \cdot \left( \frac{\min(P, 10)}{10} \right)$$
$$\mathcal{M}_{\text{regime}} = \begin{cases} 1.20 & \text{if } (D_M = \text{LONG} \land R_M = \text{AAA}) \lor (D_M = \text{SHORT} \land R_M = \text{BBB}) \\ 1.00 & \text{otherwise} \end{cases}$$
$$\text{Rank Score} = \text{Base Score} \times \mathcal{M}_{\text{regime}}$$
- Signal Intensity ($50\%$ Weight): Rewards large absolute factor magnitudes ($0.50 \cdot |\mu_S|$).
- Trigger Frequency ($30\%$ Weight): Rewards consistency across sweep scenarios ($0.30 \cdot f_{\text{active}}$).
- Persistence Streak ($20\%$ Weight): Normalizes consecutive day streaks up to a 10-day cap ($0.20 \cdot \frac{\min(P, 10)}{10}$).
- Regime Synergy Multiplier ($\mathcal{M}_{\text{regime}}$): Applies a $1.20\times$ (20% bonus) when daily direction aligns with intraday 15m EMA structure.
Step-by-Step Numerical Walkthrough
Consider the top-ranked equity SLAB from the production daily_signal_report.html:
- Lookback bars: $M = 10$
- Active triggers: 10 Long, 0 Short ($N_{\text{long}} = 10, N_{\text{short}} = 0 \implies N_{\text{active}} = 10$)
- Activity Frequency: $f_{\text{active}} = \frac{10}{10} = 1.0$
- Mean Strategy Score: $\mu_S = 144.6162$
- Latest Direction: $D_M = \text{LONG}$
- Latest 15m Regime: $R_M = \text{NEUTRAL} \implies \mathcal{M}_{\text{regime}} = 1.00$
- Trailing Persistence Streak: $P = 10\text{d} \implies \frac{\min(10, 10)}{10} = 1.0$
$$\text{Base Score} = (0.50 \times 144.6162) + (0.30 \times 1.0) + (0.20 \times 1.0) = 72.3081 + 0.30 + 0.20 = 72.8081$$
$$\text{Rank Score} = 72.8081 \times 1.00 = 72.8081$$
SLAB is ranked #1 with Latest Score = 15.5252, Avg Score = 144.6162, Price = $221.38, L/S = 10/0, Persistence = 10d, Confirmed % = 0.0%, and Rank Score = 72.8081.
Key Distinctions Between Reporting Ranking and Downstream Promising Scores
Within the quantitative platform, candidate ranking is performed across two distinct pipeline stages with clear separation of responsibilities:
| Dimension | Top Ranked Promising Symbols (daily_signal_report.html) |
Promising Symbols Ranking (promising_symbols.csv) |
|---|---|---|
| Pipeline Stage | Real-time signal engine diagnostics & parameter sweep reporting. | Downstream post-sweep candidate selection & portfolio construction. |
| Primary Focus | Mathematical signal conviction, directional streak persistence, and multi-timeframe EMA regime alignment. | Multi-factor composite scoring (Gain %, Signal Score, Directional Sentiment) and fundamental valuation metrics. |
| Data Sources | Direct timeseries database (EOD prices, 15m intraday EMAs, raw strategy signals). | Sweep results enriched with live FMP fundamentals (Revenue Growth, Forward PEG, FCF Yield, Analyst Targets). |
| Computation Engine | SignalAnalyser.compute_symbol_rankings() in Polars / Pandas. |
technosight.analytics.promising_score.rank_promising_symbols(). |
| Primary Use Case | Visualizing top-conviction active setups on the current trading day across all sweep scenarios via interactive web UI. | Exporting actionable candidate universes (top 50 Long / top 50 Short) for execution desks and portfolio allocation. |
Parameter Sweep Scenarios Comparison Table (7 Columns)
The master dashboard includes a comprehensive comparative table evaluating all 35 sweep scenarios:
| Column Header | Data Type | Description & Operational Function |
|---|---|---|
Scenario ID |
str |
Parametric scenario identifier (e.g. A1, B3, G5), hyperlinked directly to its results.html tearsheet. |
Total Signals |
int |
Total count of non-neutral signals generated across the universe within this scenario. |
Long Signals |
int |
Count of Long (+1.0) directional directives. |
Short Signals |
int |
Count of Short (-1.0) directional directives. |
Confirmation % |
float (XX.X%) |
Proportion of active signals passing 15m EMA regime alignment in this scenario. |
Mean Score |
float |
Average strategy conviction score across all active symbols in this scenario. |
Exec Time |
str (X.Xs) |
Computational runtime required to execute the vectorized scenario sweep. |
Per-Scenario Diagnostic Tearsheets (`results.html`)
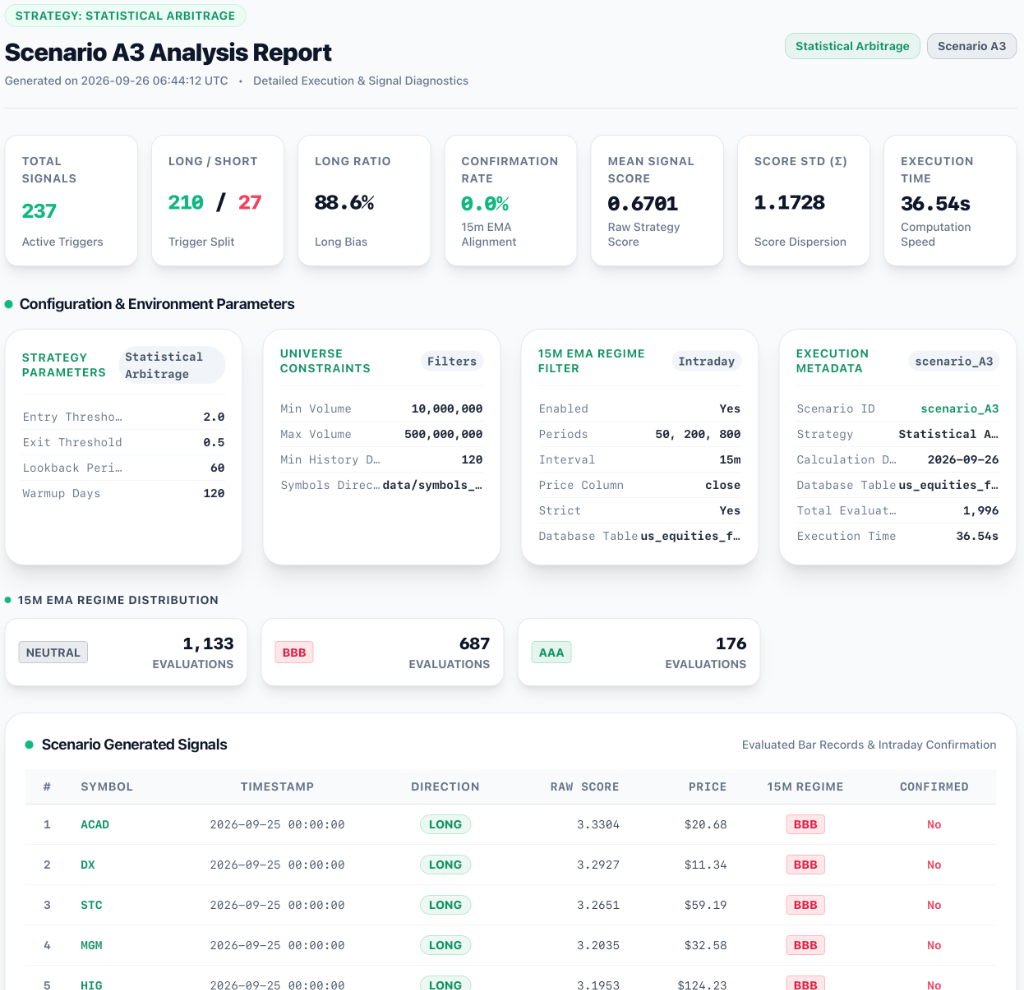
Clicking on any Scenario ID in the comparison table opens its dedicated tearsheet (scenario_<ID>/results.html), displaying:
- Cumulative Performance Curve: Visual equity chart tracking cumulative simulated returns across the scenario lookback window.
- Underwater Drawdown Plot: Visualizing historical peak-to-trough drawdowns and recovery periods.
- Monthly Return Matrix: Calendar heatmap displaying monthly returns.
- Detailed Trade Execution Log: Sortable table of all simulated historical trades with entry dates, exit dates, returns, and holding periods.