Momentum Omega Quantitative Backtesting Methodology & Simulation Reference
A complete mathematical reference for Momentum Omega backtesting, the 35 Parametric Scenarios Matrix, and diagnostic tearsheets.
Key Takeaways for Investors & Traders
Quantifies alpha through the spread between 252-day baseline momentum and 21-day short-term returns.
Scales return differentials by 126-day rolling standard deviation to equalize cross-sectional volatility risk.
Exhaustively maps 7 liquidity tranches (A to G) against 5 lookback horizon tiers (Tiers 1 to 5).
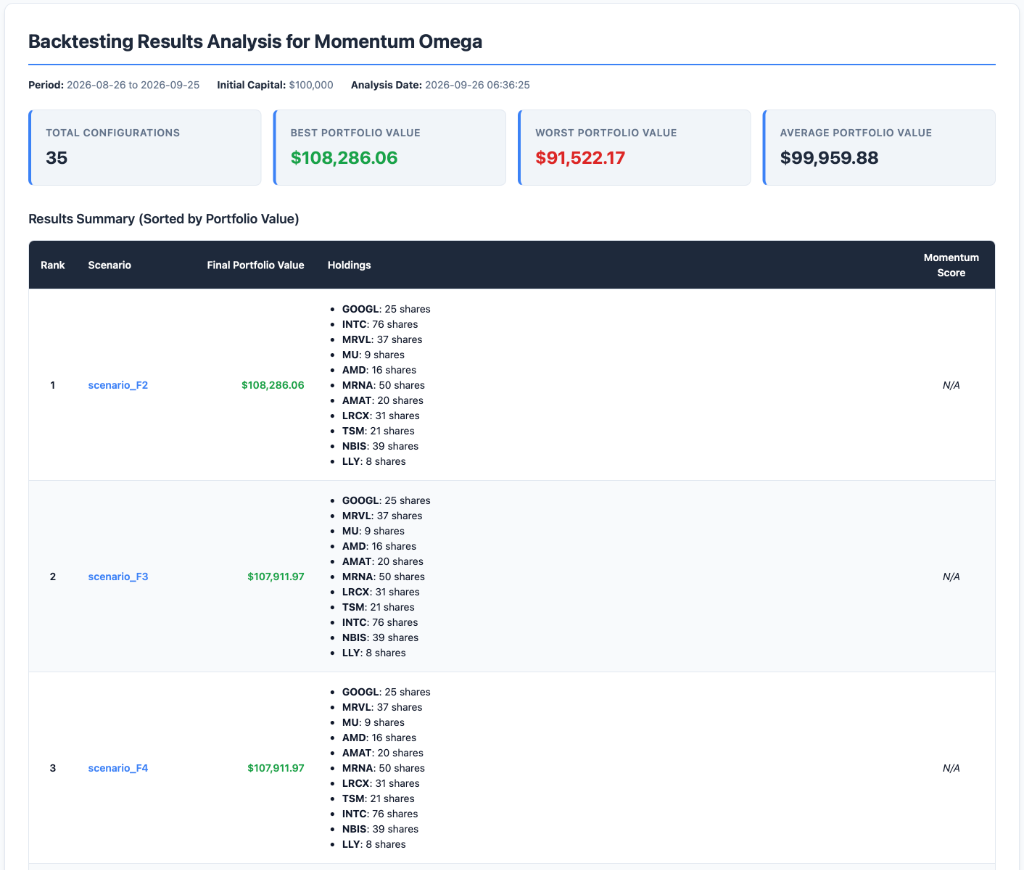
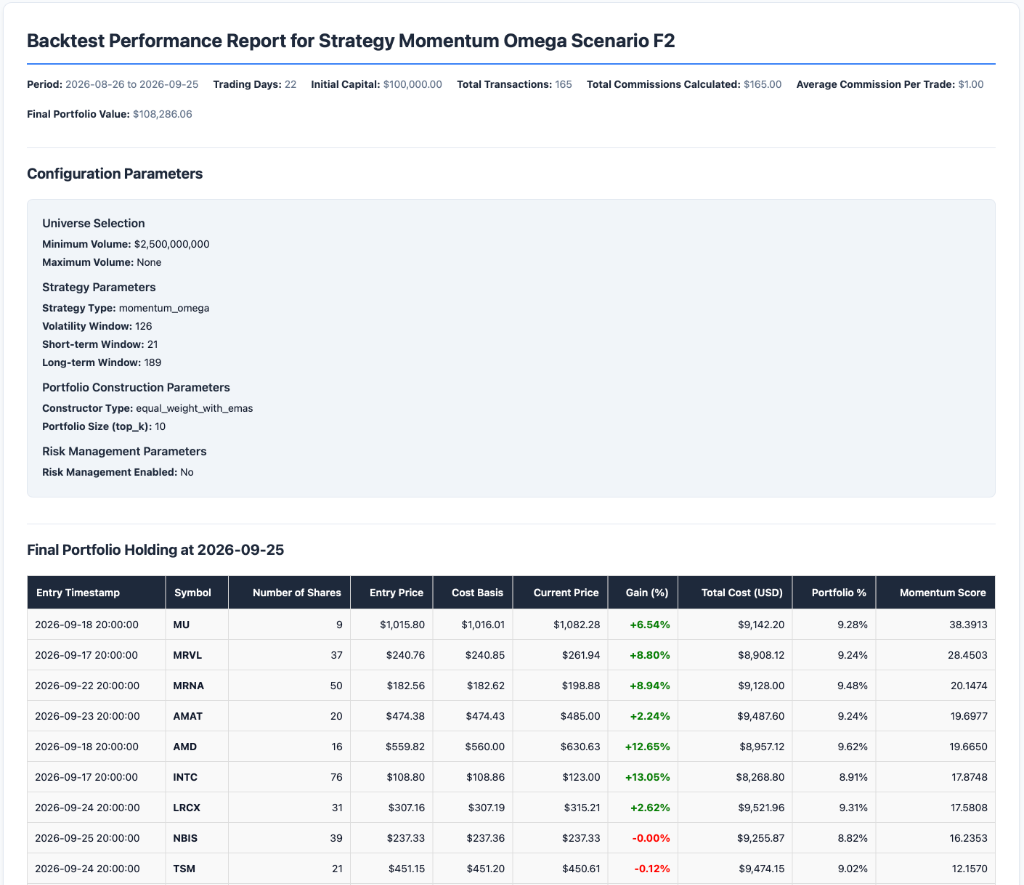
Evaluates performance via single-scenario report.html tearsheets and cross-scenario analysis.html comparative matrices.
Executive Summary
This document provides the dedicated quantitative methodology for backtesting the Momentum Omega strategy. It details the momentum differential formula, volatility normalization mechanics, the complete 35 Parametric Scenarios Matrix (Tranches A1 through G5), and tearsheet diagnostic interpretation.
Momentum Omega Quantitative Formulation
The Momentum Omega alpha calculation executes across three mathematical stages:
Step 1: Return Horizon Quantification
For each asset $i$ at day $t$, two distinct horizon returns are evaluated using split- and dividend-adjusted closing prices:
$$R_{\text{long}}(t) = \frac{P_t}{P_{t - N_{\text{long}}}} - 1.0 \quad (N_{\text{long}} = 252 \text{ trading days})$$
$$R_{\text{short}}(t) = \frac{P_t}{P_{t - N_{\text{short}}}} - 1.0 \quad (N_{\text{short}} = 21 \text{ trading days})$$
Step 2: Raw Momentum Differential
The raw differential measures intermediate trend persistence relative to short-term price velocity:
$$\Delta_{\text{momentum}}(t) = R_{\text{long}}(t) - R_{\text{short}}(t)$$
Step 3: Volatility Normalization (126-Day Standard Deviation)
To prevent high-beta, highly erratic equities from dominating rankings, the differential is scaled by historical return dispersion over volatility window $W_{\text{vol}} = 126$ trading days:
$$r_{t-k} = \frac{P_{t-k}}{P_{t-k-1}} - 1.0, \quad \bar{r} = \frac{1}{W_{\text{vol}}} \sum_{k=0}^{W_{\text{vol}}-1} r_{t-k}$$
$$\sigma_{126}(t) = \sqrt{\frac{1}{W_{\text{vol}}} \sum_{k=0}^{W_{\text{vol}}-1} (r_{t-k} - \bar{r})^2}$$
$$\text{Score}_{\Omega}(t) = S_{\text{raw}}(t) = \frac{\Delta_{\text{momentum}}(t)}{\sigma_{126}(t)}$$
Candidate Filtering & Intraday Technical Confirmation
Candidate equities are partitioned and verified through technical confirmation:
- Long Candidate Pool: Equities exhibiting positive score conviction ($S_{\text{raw}}(t) > 0.0$), ranked in descending order of conviction.
- Short Candidate Pool: Equities exhibiting negative score conviction ($S_{\text{raw}}(t) < 0.0$), ranked in ascending order.
- Intraday 15m EMA Gatekeeping: Long candidates must verify that intraday 15-minute price action is trading above key EMA levels ($EMA_{50} > EMA_{200} > EMA_{800}$), tagging candidates with an
AAAregime rating. - Strict Look-Ahead Defense: Indicators calculated on day $T$ close are strictly barred from execution until day $T+1$ open.
The 35 Parametric Scenarios Matrix (Tranches A1 through G5)
To ensure that reported alpha is robust across liquidity regimes and lookback horizons, Momentum Omega is backtested across an exhaustive 35-scenario parametric matrix:
Dimension 1: Liquidity & Traded Volume Tiers (Groups A through G)
- Group A: USD 10M $\le \text{ADV} <$ USD 25M (Micro/Small-Cap).
- Group B: USD 25M $\le \text{ADV} <$ USD 50M (Small-Cap).
- Group C: USD 50M $\le \text{ADV} <$ USD 100M (Small/Mid-Cap).
- Group D: USD 100M $\le \text{ADV} <$ USD 250M (Mid-Cap).
- Group E: USD 250M $\le \text{ADV} <$ USD 500M (Upper Mid-Cap).
- Group F: USD 500M $\le \text{ADV} <$ USD 1.0B (Large-Cap).
- Group G: $\text{ADV} \ge$ USD 1.0B (Mega-Cap).
Dimension 2: Lookback Horizon & Parameter Variations (Indices 1 through 5)
- Index 1 (12M Secular Trend): $N_{\text{long}} = 252$, $N_{\text{short}} = 21$, $W_{\text{vol}} = 126$.
- Index 2 (9M Intermediate Trend): $N_{\text{long}} = 189$, $N_{\text{short}} = 21$, $W_{\text{vol}} = 94$.
- Index 3 (6M Medium Trend): $N_{\text{long}} = 126$, $N_{\text{short}} = 15$, $W_{\text{vol}} = 63$.
- Index 4 (3M Short-Intermediate): $N_{\text{long}} = 63$, $N_{\text{short}} = 10$, $W_{\text{vol}} = 42$.
- Index 5 (Tactical Horizon): $N_{\text{long}} = 21$, $N_{\text{short}} = 5$, $W_{\text{vol}} = 21$.
Complete 35-Scenario Parametric Matrix Reference Table
| Liquidity Group / Horizon | Index 1 (12M) | Index 2 (9M) | Index 3 (6M) | Index 4 (3M) | Index 5 (Tactical) |
|---|---|---|---|---|---|
| Group A ($10M–$25M) | A1 |
A2 |
A3 |
A4 |
A5 |
| Group B ($25M–$50M) | B1 |
B2 |
B3 |
B4 |
B5 |
| Group C ($50M–$100M) | C1 |
C2 |
C3 |
C4 |
C5 |
| Group D ($100M–$250M) | D1 |
D2 |
D3 |
D4 |
D5 |
| Group E ($250M–$500M) | E1 |
E2 |
E3 |
E4 |
E5 |
| Group F ($500M–$1.0B) | F1 |
F2 |
F3 |
F4 |
F5 |
| Group G (>$1.0B) | G1 |
G2 |
G3 |
G4 |
G5 |
Execution Modeling & Tearsheet Diagnostics
Execution Realism Standards
- Trade Timing: Day $T$ close signal triggers Day $T+1$ open fill.
- Commissions: USD 0.0035/share ($1.00 min, 1% cap).
- Slippage: VolumeShareSlippage ($c_{\text{impact}} = 0.05$, 20% bar volume limit).
Diagnostic Tearsheet Interfaces
The simulation produces two complementary diagnostic interfaces:
1. Single-Scenario Tearsheet (report.html)
Focuses on a single tranche (e.g. C3 or F2), providing cumulative equity curves, configuration parameters, final portfolio holdings, monthly returns heatmaps, rolling Sharpe ratios, underwater drawdown curves, and top winner/loser attribution tables.
2. Comparative Multi-Scenario Analysis (analysis.html)
Evaluates all 35 cells simultaneously in a heatmapped grid and ranked summary cards, allowing researchers to verify parameter stability across liquidity tranches and lookback horizons.